

On September 18, 2026, the Bank of Japan raised interest rates to their highest level in three decades. If you’d learned the textbook rule, “higher rates mean a stronger currency,” you’d have expected the yen to jump. It fell instead, and USD/JPY traded near 157 afterwards.
That one episode explains why so many beginners lose their way with forex fundamentals. Central banks drive currencies, but not in the simple, mechanical way most guides suggest. What matters is what a bank does compared with what markets expected, and compared with the other central bank on the other side of the pair.
This guide gives you the major central banks explained in plain English. We’ll cover the six institutions that set interest rates for the most-traded currencies: the Federal Reserve (Fed), European Central Bank (ECB), Bank of Japan (BoJ), Bank of England (BoE), Reserve Bank of Australia (RBA) and Reserve Bank of New Zealand (RBNZ). You’ll see how each one works, how their decisions travel into exchange rates, stocks, bonds, gold and crypto, and how to follow them without reacting to every headline.
The short answer
Central banks move forex markets mainly by changing expected interest rates. Money tends to flow
toward currencies where returns are expected to be higher, so a currency usually reacts to how a decision and its
guidance differ from what traders had already priced in, and to how that bank’s path compares with the other bank
in the pair.
Key Takeaways
- Six banks, six majors. The Fed (USD), ECB (EUR), BoJ (JPY), BoE (GBP), RBA (AUD) and RBNZ (NZD) set the policy rates behind EUR/USD, USD/JPY, GBP/USD, AUD/USD, NZD/USD and their crosses.
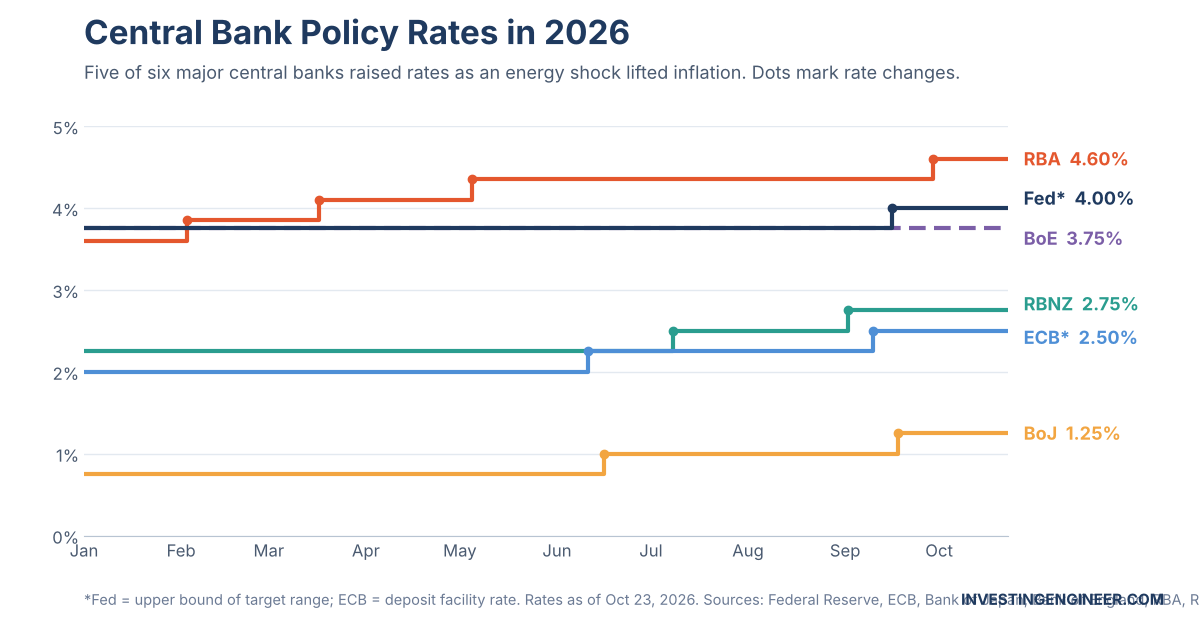
- 2026 is a hiking year again. An energy-price shock pushed inflation above target almost everywhere. By the end of September 2026, the Fed, ECB, BoJ, RBA and RBNZ had all raised rates, and markets expected the BoE to follow on November 5.
- Expectations beat headlines. A fully expected hike can weaken a currency, as the yen showed in September 2026. A smaller-than-feared cut can strengthen one.
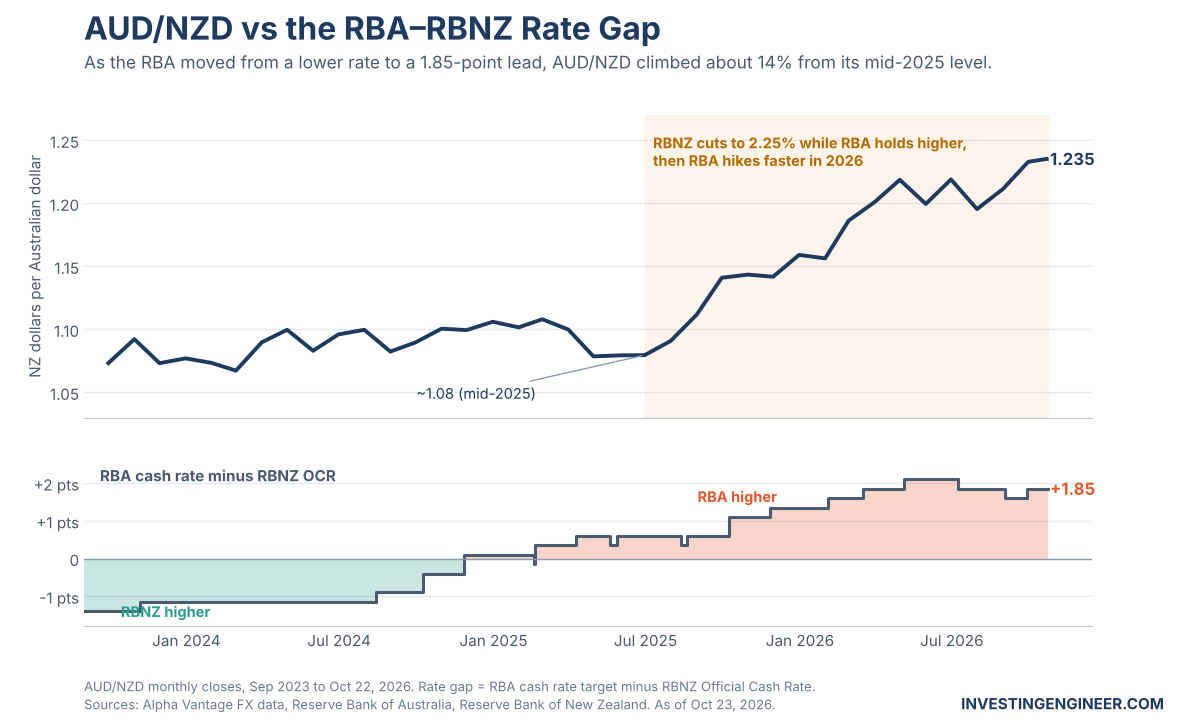
- The gap matters more than the level. With the RBA at 4.60% and the RBNZ at 2.75%, AUD/NZD climbed from about 1.08 in mid-2025 to about 1.235 in October 2026.
- Watch the full message. The statement, projections, vote split and press conference often move a currency more than the rate decision itself.
- Rates ripple everywhere. Policy shifts change bond yields, stock valuations, gold’s appeal and crypto liquidity, but none of those links is guaranteed.
What Is a Central Bank?
A central bank is the public institution that manages a country’s or currency area’s money. It sets short-term interest rates, supplies reserves to commercial banks and acts as lender of last resort in a crisis. In advanced economies, central banks are legally independent so they can pursue low, stable inflation without day-to-day political pressure.
What Central Banks Actually Do
- Set the policy rate: the short-term interest rate that anchors overnight borrowing between banks.
- Manage liquidity: add or drain reserves through lending operations and bond holdings.
- Communicate: publish statements, forecasts and speeches that shape what markets expect next.
- Protect financial stability: lend to sound banks in a crisis and oversee parts of the financial system.
Monetary Policy in One Minute
Monetary policy is how a central bank uses interest rates and its balance sheet to steer inflation and economic activity. When inflation runs too hot, it tightens (raises rates or shrinks its balance sheet) to cool borrowing and spending. When the economy weakens and inflation is low, it eases (cuts rates or buys bonds). Changes take months, sometimes years, to work through the economy.
Why Forex Traders Watch Central Banks So Closely
Every currency pair is a comparison of two economies. Interest rates are the most direct link between an economy and the return on holding its currency. If markets expect US rates to stay higher than eurozone rates for longer, dollar-denominated deposits and bonds become relatively more attractive. That can support the dollar against the euro, all else being equal.
Think of a currency pair as a seesaw. To understand EUR/USD you need to know what is happening at both ends: the ECB and the Fed.
Major Central Banks Explained: The Six That Move Forex
Here’s the reference table. Bookmark it, but remember that policy rates and meeting dates change. Everything below was checked against official sources on October 23, 2026.
| Field | Fed | ECB | BoJ | BoE | RBA | RBNZ |
|---|---|---|---|---|---|---|
| Jurisdiction | United States | Euro area (21 countries) | Japan | United Kingdom | Australia | New Zealand |
| Currency | USD | EUR | JPY | GBP | AUD | NZD |
| Policy committee | FOMC (12 voters) | Governing Council | Policy Board (9) | MPC (9) | Monetary Policy Board | Monetary Policy Committee |
| Main instrument | Fed funds target range | Deposit facility rate (DFR) | Overnight call rate | Bank Rate | Cash rate target | Official Cash Rate (OCR) |
| Rate (Oct 23, 2026) | 3.75%–4.00% | DFR 2.50% (MRO 2.65%) | ~1.25% | 3.75% | 4.60% | 2.75% |
| Last move | +0.25, Sep 16, 2026 | +0.25, Sep 10, 2026 | +0.25, Sep 18, 2026 | Hold, Sep 17, 2026 (6–3 vote) | +0.25, Sep 29, 2026 | +0.25, Sep 2, 2026 |
| Mandate | Dual: max employment + stable prices | Price stability (primary) | Price stability | Price stability, then support govt policy | Price stability + full employment | Price stability (single, since Dec 2024) |
| Inflation target | 2% PCE | 2% HICP, medium term | 2% CPI | 2% CPI | 2–3% CPI (2.5% midpoint) | 1–3% CPI (2% midpoint) |
| Latest inflation | CPI 3.7% (Sep) | HICP 3.8% (Sep) | Core CPI 2.1% (Sep) | CPI 3.5% (Sep) | CPI 4.0% (Aug); trimmed mean 3.6% | CPI 4.1% (Q2) |
| Meetings per year | 8 | 8 (about every 6 weeks) | 8 | 8 | 8 | About every 6 weeks |
| Next decision | Oct 28, 2026 | Oct 29, 2026 | Oct 30, 2026 | Nov 5, 2026 | Nov 3, 2026 | Oct 28, 2026 |
| Key inflation gauge | PCE, core PCE, CPI | HICP flash, core HICP | Core and core-core CPI | CPI, services CPI | Trimmed mean CPI | Quarterly CPI |
| Key jobs gauge | Nonfarm payrolls, unemployment | Unemployment, wage tracker | Shunto wage talks | Average earnings, LFS | Labour Force, Wage Price Index | Quarterly employment, wages |
| Main statement | FOMC statement, SEP (dot plot), minutes | Monetary policy statement, staff projections | Statement, Outlook Report | Monetary Policy Summary, MPR | Board statement, SMP, minutes | Review / MPS with OCR track |
| Pairs to watch | EUR/USD, USD/JPY, GBP/USD, AUD/USD, NZD/USD | EUR/USD, EUR/GBP, EUR/JPY, EUR/AUD | USD/JPY, EUR/JPY, AUD/JPY | GBP/USD, EUR/GBP, GBP/JPY | AUD/USD, AUD/JPY, AUD/NZD | NZD/USD, AUD/NZD, NZD/JPY |
Sources: Federal Reserve, ECB, Bank of Japan, Bank of England, RBA, RBNZ; inflation data from the BLS, Eurostat, Statistics Bureau of Japan, ONS, ABS and Stats NZ. Meeting dates are tentative and can change. Five of these decisions fall between October 28 and November 5, 2026, so check for updates.
The Differences That Matter Most
- Rate type. The Fed sets a 0.25-point range. The other five set a single rate. The ECB has three rates; the deposit facility rate is the one that steers money markets, so it’s the one traders quote.
- Mandate. The Fed and RBA have dual goals (prices and jobs). The ECB, BoJ, BoE and, since December 2024, the RBNZ put price stability first.
- Inflation gauge. The Fed targets PCE inflation, not CPI. The ECB uses HICP. The RBA focuses on the trimmed mean, a core measure that strips out the biggest price swings.
- Target vs reading. The target (say 2%) is the goal. The latest reading (say 3.7%) is where inflation is now. The gap between the two shapes the next decision.
The Federal Reserve (Fed) Explained
Mandate and Decision-Makers
The Fed has a dual mandate: maximum employment and stable prices. It defines price stability as 2% inflation measured by the Personal Consumption Expenditures (PCE) price index. Policy is set by the Federal Open Market Committee (FOMC): the seven Board governors, the president of the New York Fed and four of the other eleven regional Fed presidents on rotation. Kevin Warsh became Chair on May 22, 2026. (For background, see our guide to new Fed Chair Kevin Warsh.)
In August 2025 the Fed published a revised strategy statement that dropped its 2020 “make-up” approach to inflation and committed to reviewing its framework about every five years.
Policy Tools
The main tool is the federal funds target range. On September 16, 2026 the FOMC voted 12–0 to raise it by 0.25 point to 3.75%–4.00%, its first hike since July 2023. Warsh’s summary was blunt: “Inflation is too high and has been for too long.” Policymakers’ median projection pointed to one more hike in 2026. The Fed also manages its balance sheet, and currently describes its approach as maintaining “ample reserves.”
The FOMC meets eight times a year. Four meetings (March, June, September, December) include the Summary of Economic Projections and its “dot plot” of each official’s rate forecast. Minutes follow three weeks after each meeting. See the FOMC calendar.
Indicators to Watch
- CPI and PCE inflation (headline and core)
- Nonfarm payrolls, unemployment rate and wage growth
- GDP, retail sales and business surveys
- FOMC statement, dot plot, minutes and Fed speeches
- 2-year and 10-year Treasury yields
What It Means for the US Dollar
The dollar is the world’s main reserve, trade and funding currency. That gives the Fed outsized influence: when US rate expectations rise, borrowing costs tighten worldwide, emerging-market currencies often weaken and USD-priced commodities can feel pressure. A useful habit: when you look at any pair with USD in it, check the Fed first.
The European Central Bank (ECB) Explained
Mandate and Decision-Makers
The ECB’s primary objective is price stability, defined as 2% HICP inflation over the medium term, with deviations in either direction treated as equally undesirable. The Governing Council sets policy. It combines the six-member Executive Board with the governors of the national central banks of the euro area, which has 21 members since Bulgaria joined on January 1, 2026. Christine Lagarde is President.
Policy Tools: Three Rates, One That Matters Most
The ECB sets three rates. The deposit facility rate (DFR) is what banks earn on overnight deposits at the ECB and is the rate that steers money markets. The main refinancing operations (MRO) rate and the marginal lending facility (MLF) rate sit above it. After hikes on June 11 and September 10, 2026, they stand at 2.50%, 2.65% and 2.90%. When you read “ECB rates are at 2.5%,” that’s the DFR.
The ECB has also stopped buying bonds and is letting its holdings run off as they mature. It meets roughly every six weeks; the next meetings are October 28–29 and December 16–17, 2026 (ECB calendar).
One Interest Rate for 21 Economies
This is the ECB’s unique challenge. Germany, France, Italy, Spain and the rest share one rate, even when their growth, inflation and debt levels differ. That’s why traders focus on eurozone-wide data and watch government bond spreads (for example, Italian versus German 10-year yields) as a stress gauge.
Indicators to Watch
- HICP flash inflation (headline and core), released around the start of each month
- PMI surveys and GDP
- Wage growth and unemployment
- Bank lending survey
- Staff projections (March, June, September, December)
What It Means for the Euro
In September 2026 the ECB projected headline inflation at 3.0% for 2026, easing to 2.1% by 2028, with risks to inflation tilted up and risks to growth tilted down. That mix, higher inflation and weak growth, is awkward for the euro: the ECB hikes, but markets question how far it can go. EUR/USD traded around 1.12 in late October 2026.
The Bank of Japan (BoJ) Explained
Mandate and Decision-Makers
The BoJ pursues price stability, defined as a 2% CPI inflation target adopted in 2013. A nine-member Policy Board, led by Governor Kazuo Ueda, holds eight Monetary Policy Meetings a year and publishes its Outlook Report four times a year.
From Deflation to Rate Hikes
Japan spent much of the past three decades fighting deflation. The BoJ cut rates to zero, bought vast amounts of government bonds and, from 2016 to March 2024, ran negative interest rates. Since then it has been normalising step by step. On September 18, 2026, it raised its policy rate to around 1.25%, the highest since 1995, on a 7–2 vote.
Japan’s core inflation (excluding fresh food) rose to 2.1% in September 2026, back above target for the first time in nine months. Ueda has said “we shouldn’t rule anything out” on the pace of future hikes. The next meeting is October 29–30, 2026.
The Yen Carry Trade
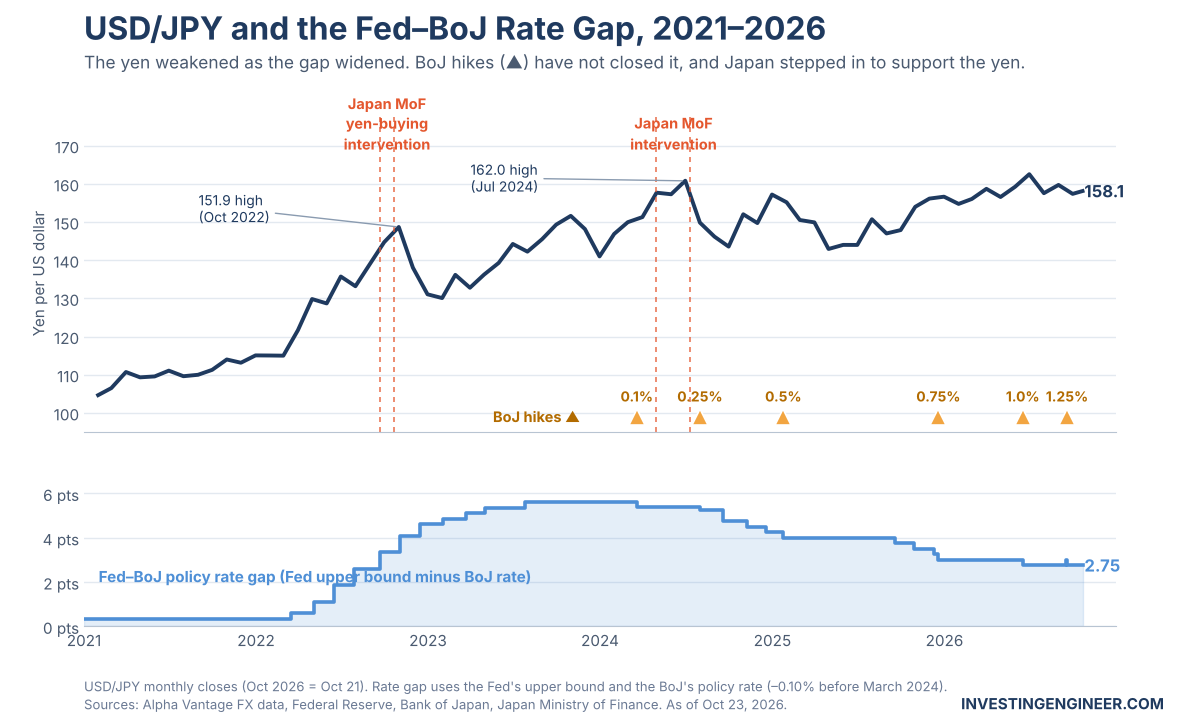
A carry trade means borrowing in a low-interest currency and investing in a higher-yielding one. Because Japanese rates were so low for so long, the yen became the world’s favourite funding currency. Carry trades pay while exchange rates stay calm, but they can unwind violently. In July 2024 USD/JPY peaked near 162. After the BoJ hiked on July 31, 2024 and weak US jobs data followed, the pair dropped toward 142 within weeks, and Japan’s Nikkei fell 12.4% on August 5, 2024.
Indicators to Watch
- National and Tokyo CPI (core and core-core)
- Shunto spring wage negotiations
- Tankan business survey
- 10-year Japanese government bond (JGB) yields
- BoJ Outlook Report and Summary of Opinions
- Ministry of Finance comments on the yen (intervention risk)
What It Means for the Yen
The yen shows why you can’t analyse a currency through domestic rates alone. Even at 1.25%, Japan’s policy rate sits roughly 2.5 points below the Fed’s. That gap, global risk sentiment and the threat of Ministry of Finance intervention often matter more than any single BoJ decision. As Ueda put it in September 2026: “We don’t guide policy to control currency moves.”
The Bank of England (BoE) Explained
Mandate and Decision-Makers
The BoE’s job is to keep inflation at the 2% CPI target set by the government, and, subject to that, to support the government’s economic policy. The nine-member Monetary Policy Committee (MPC) includes Governor Andrew Bailey, three deputy governors, the chief economist and four external members. Each member’s vote is published, which makes the vote split a market-moving signal in its own right.
Policy Tools
The main tool is Bank Rate, which feeds into mortgage rates, savings rates and business borrowing. On September 17, 2026, the MPC held Bank Rate at 3.75%, but three members voted to hike to 4%. UK CPI then rose to 3.5% in September, with services inflation at 3.7%. Markets priced a hike at the November 5 meeting as highly likely.
Why UK Policy Has Its Own Quirks
- Mortgages: many households hold 2- or 5-year fixed-rate loans, so rate changes reach them with a delay.
- Wages and services inflation: these are the MPC’s favourite gauges of home-grown price pressure.
- Fiscal policy: budgets and gilt-market stress can change the rate outlook fast. (See how UK fiscal plans can move gilts and sterling.)
Indicators to Watch
- CPI, core CPI and services CPI
- Average weekly earnings and the Labour Force Survey
- Monthly GDP and retail sales
- MPC vote split, minutes and the quarterly Monetary Policy Report
What It Means for the Pound
Sterling can react sharply to unexpected guidance, especially when the vote split surprises. A 6–3 hold with three hawks reads very differently from a 9–0 hold, even though the rate is the same.
The Reserve Bank of Australia (RBA) Explained
Mandate and Decision-Makers
The RBA has dual objectives: price stability and full employment. Its inflation target is 2–3%, with a focus on the 2.5% midpoint. Since March 2025, decisions are made by a dedicated Monetary Policy Board chaired by Governor Michele Bullock, who holds a press conference after every meeting. The Board meets eight times a year (2026 dates).
Policy Tools
The cash rate target is the RBA’s main tool. After cutting to 3.60% in 2025, the RBA reversed course in 2026. On September 29, 2026 it raised the cash rate to 4.60%, its fourth hike of the year, citing higher fuel costs, rising business cost pressures and elevated short-term inflation expectations. The next decision is November 3, 2026.
Commodities, China and Risk Appetite
Australia is a major exporter of iron ore, coal and LNG, and China is its biggest customer. So the Australian dollar responds to commodity prices, Chinese demand and global risk appetite as well as to the RBA. In risk-off episodes, AUD often falls even when Australian rates are high.
Indicators to Watch
- CPI, especially the trimmed mean (monthly and quarterly)
- Labour Force survey and Wage Price Index
- GDP and household spending
- Iron ore prices and Chinese activity data
- RBA statement, minutes and quarterly Statement on Monetary Policy
What It Means for the Aussie
Expectations do the heavy lifting. When Australia’s August 2026 CPI came in at 4.0%, slightly below the 4.1% forecast, the AUD fell about 0.3% against the dollar as traders trimmed bets on another hike, even though inflation had risen from 3.5%.
The Reserve Bank of New Zealand (RBNZ) Explained
Mandate and Decision-Makers
Since December 2024, the RBNZ has a single mandate: price stability. Its target is 1–3% CPI inflation, with a focus on the 2% midpoint. Decisions are made by the Monetary Policy Committee, led by Governor Anna Breman, who took office in December 2025. New Zealand pioneered formal inflation targeting in 1990, and the RBNZ still stands out for publishing its own projected path for future rates.
Policy Tools
The Official Cash Rate (OCR) is the rate banks earn on deposits with the RBNZ. Because many New Zealand mortgages are on floating or short fixed terms, OCR changes pass through to households quickly. After cutting from 5.50% to 2.25%, the RBNZ raised the OCR to 2.75% on September 2, 2026. Inflation was 4.1% in the June 2026 quarter. Next reviews: October 28 and December 9, 2026.
Dairy, Housing and a Small Open Economy
Dairy is New Zealand’s biggest goods export, so Global Dairy Trade auction prices feed into NZD sentiment. As a small, trade-exposed economy, New Zealand’s currency is also sensitive to shifts in global risk appetite.
Indicators to Watch
- Quarterly CPI and core inflation measures
- Quarterly employment and wage data
- GDP and business confidence
- Global Dairy Trade prices and house prices
- Monetary Policy Statements and the OCR projection
Why the Kiwi Doesn’t Always Follow the Aussie
AUD and NZD are neighbours, not twins. Different inflation rates, different interest-rate paths and different export mixes (metals and energy vs dairy and food) mean the two can diverge for long stretches. We’ll see a big example below.
How Central Banks Influence Forex Markets
Now for the mechanisms. Each one tells you what tends to happen and what can break the relationship.
Interest Rate Hikes
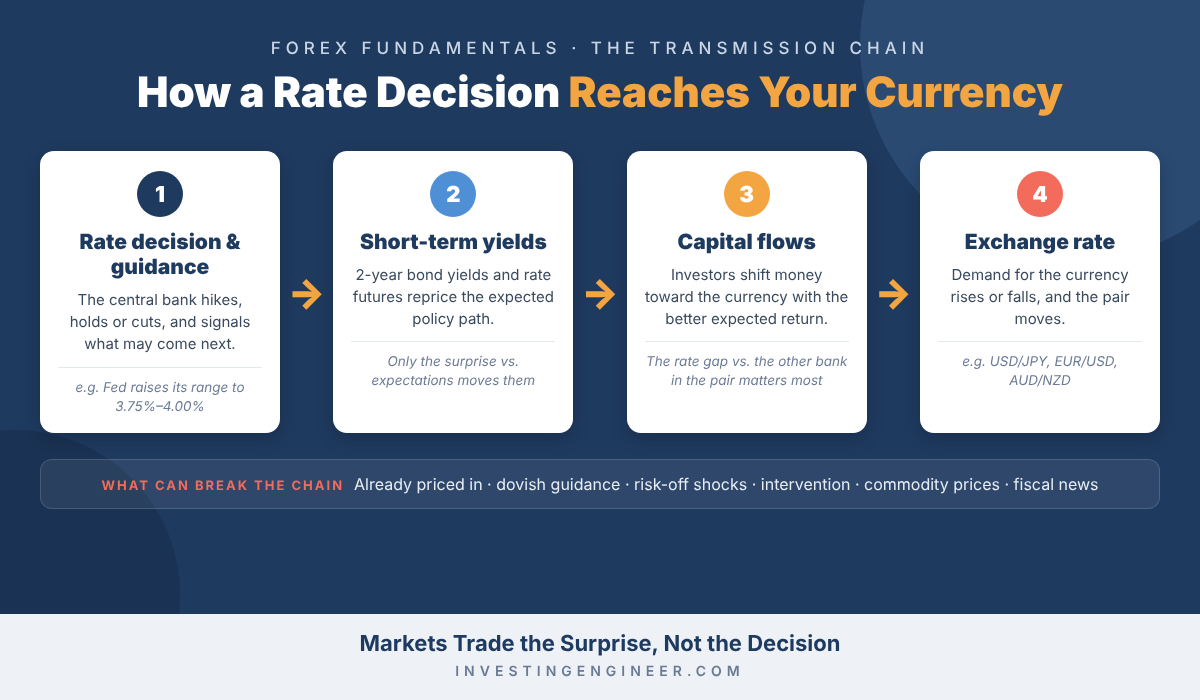
A hike raises the return on deposits and short-term bonds in that currency. If other things stay the same, that can attract capital and support the currency. But: if the hike was fully expected, it’s already in the price. And if the bank pairs the hike with soft guidance (“this may be the last one”), the currency can fall.
Interest Rate Cuts
A cut usually narrows a currency’s yield advantage. But: if traders feared a bigger cut, or if the bank sounds upbeat about growth, the currency can rise after a cut. Markets trade the surprise, not the decision.
Hawkish vs Dovish
| Term | What it signals | Typical currency reaction (all else equal) |
|---|---|---|
| Hawkish | More concern about inflation; less easing or more tightening than markets expected | Supportive |
| Dovish | More concern about growth; more easing or less tightening than markets expected | Negative |
Both words are relative to expectations. A rate hike can be dovish. A cut can be hawkish.
Interest Rate Differentials
An interest rate differential is the gap between two economies’ rates. In late October 2026, the Fed’s range (3.75%–4.00%) sat roughly 2.5 points above the BoJ’s 1.25%, and about 1.25–1.5 points above the ECB’s deposit rate. The gap that matters most for currency moves, though, is the expected future differential. Traders read it from 2-year government bond yields and interest-rate futures, not only from today’s policy rates.
Monetary Policy Divergence
Divergence happens when two central banks move in different directions or at different speeds.
Hypothetical example (not a forecast)
- The Fed signals US rates may stay elevated.
- The ECB signals eurozone rates may fall.
- Markets reprice the expected US–eurozone yield gap wider in the dollar’s favour.
All else equal, that could support the dollar against the euro (EUR/USD lower). It could be undone by weaker US data,
a surprise ECB turn, or a global shock that hits the dollar.
Forward Guidance and Market Expectations
Forex markets move before decisions because traders continuously price what central banks are likely to do. Data releases, speeches, minutes and projections shift those expectations week by week. By meeting day, much of the move may already have happened. That’s why the reaction depends on the difference between what was anticipated and what was delivered, including the tone.
Quantitative Easing and Quantitative Tightening
Quantitative easing (QE) means a central bank buys bonds to push down longer-term yields and add liquidity. Quantitative tightening (QT) is the reverse: it lets bonds mature or sells them. QE can weigh on a currency and QT can support it, but the effects are uncertain and depend on conditions, so don’t treat them as fixed rules.
Risk Sentiment and Safe-Haven Flows
In global stress, investors often buy the US dollar (because the world borrows in it) and sometimes the yen (as carry trades unwind). Commodity-linked currencies like AUD and NZD tend to fall. But safe-haven behaviour isn’t automatic. In 2022, the yen weakened sharply during a risk-off year because the gap between US and Japanese rates was widening so fast.
Why a currency can fall after a rate hike: the BoJ in September 2026
On September 18, 2026, the BoJ raised rates to 1.25%, a three-decade high. The yen still fell. Here’s why:
- It was expected. Strong wage data had made the hike widely anticipated, so it was largely priced in.
- The vote was split. Two members dissented in favour of waiting, a dovish signal.
- No clear next step. The BoJ didn’t explicitly signal the next hike’s timing.
- The other side moved too. Two days earlier the Fed had hiked to 3.75%–4.00%, keeping the US–Japan gap wide.
Lesson: judge a decision by the whole message and by the other central bank in the pair.
How to Analyse a Central Bank Meeting
Before the Meeting
- Read the latest inflation and jobs data. Are they moving toward or away from target?
- Re-read the last statement. What did the bank say it was watching?
- Check market pricing. Tools such as CME FedWatch or broker economic calendars show what’s expected. The consensus is your benchmark.
- Note recent speeches. Officials often pre-signal big shifts.
- Watch 2-year bond yields. They’re the market’s running estimate of the policy path.
During the Announcement
- The decision: in line with expectations, bigger or smaller?
- The statement: compare the wording with the previous one. Small edits can matter.
- Inflation and growth assessment: more worried, or less?
- Vote split (BoE, BoJ, FOMC dissents): how united is the committee?
- Projections: dot plot, staff forecasts or OCR track, where published.
- Press conference: tone and answers to “what’s next?” questions.
After the Announcement
The first move isn’t always the real one. Imagine a bank raises rates but hints that it’s done. Traders may buy the currency on the headline, then sell it as they digest the guidance. Separate the headline decision from the overall policy message, and give the market time to settle before drawing conclusions.
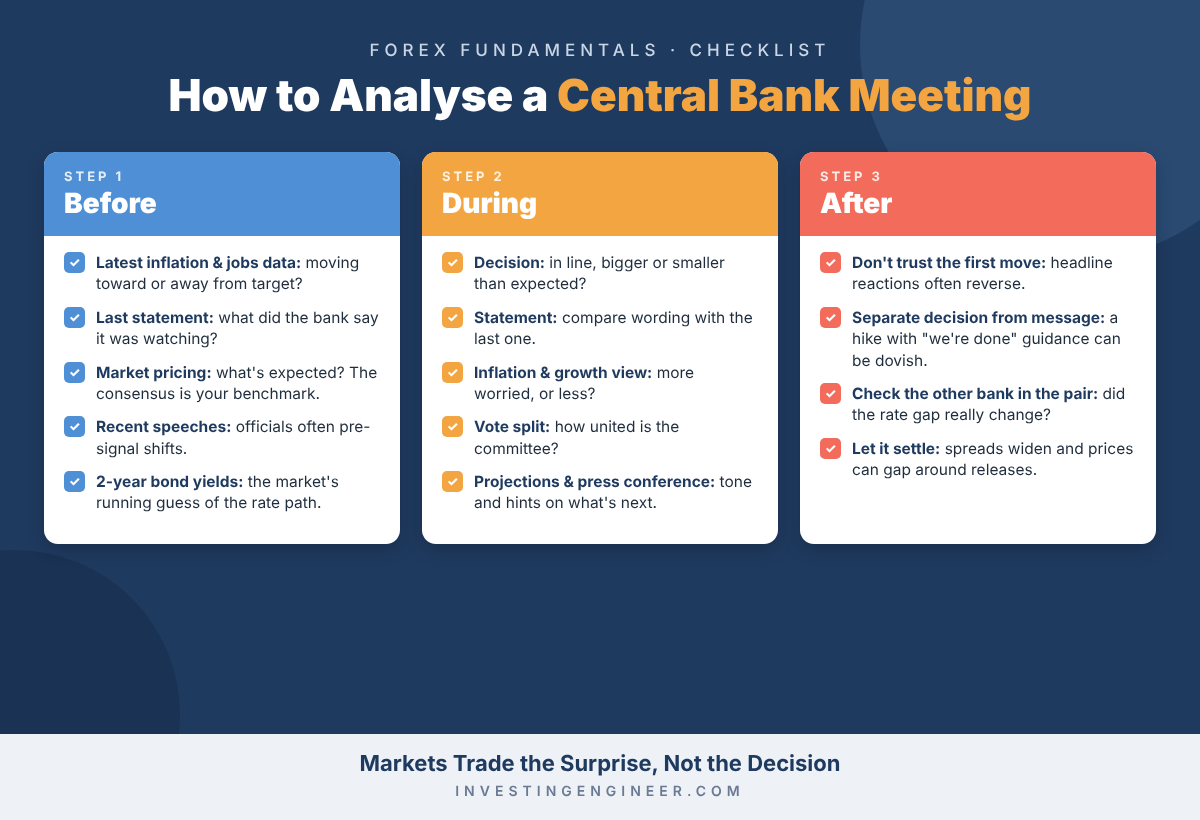
Spreads can widen and prices can gap around these announcements, so many experienced traders reduce position size or stay flat into the release. If you’re new, watching a meeting on a demo account is an excellent way to learn how prices actually behave.
Practise before you trade
Watch your next central bank meeting on a demo account
Reading a decision is one thing. Seeing how EUR/USD or USD/JPY actually moves when the statement drops, how spreads widen and how the first reaction can reverse, is another.
A Pepperstone demo account lets you follow the next Fed, ECB or BoJ announcement with virtual funds, so you can practise the before/during/after checklist without risking real money.
Open a Pepperstone demo account →
Affiliate link. CFDs are complex instruments and come with a high risk of losing money rapidly due to leverage.
Most retail investor accounts lose money when trading CFDs. Consider whether you understand how CFDs work and
whether you can afford to take the high risk of losing your money. Availability and protections depend on your
country of residence.
The Economic Indicators Forex Traders Should Watch
| Indicator category | What it helps you assess |
|---|---|
| Inflation | Whether price pressures are moving toward or away from the target |
| Employment | Labour market strength and potential wage pressure |
| Wages | Home-grown cost pressure and household purchasing power |
| GDP growth | The overall strength or weakness of the economy |
| Consumer spending | Demand conditions and household resilience |
| Business surveys (PMIs, Tankan) | Early signals of economic momentum |
| Bond yields | Market pricing of future rates, inflation and risk |
| Central bank communications | How policymakers themselves read incoming data |
No single number decides a policy move. Strong jobs data argues for tighter policy if inflation is sticky, but means less if inflation is falling fast or productivity is booming. Each bank also has favourites:
| Bank | Data that moves expectations most |
|---|---|
| Fed | CPI, core PCE, nonfarm payrolls |
| ECB | HICP flash inflation, PMIs, wage tracker |
| BoJ | Core and core-core CPI, Shunto wages, Tokyo CPI |
| BoE | Services CPI, average earnings |
| RBA | Trimmed mean CPI, unemployment rate |
| RBNZ | Quarterly CPI, employment, dairy prices |
How Central Bank Decisions Affect Stocks, Bonds, Gold, and Crypto
You don’t have to trade forex for central banks to matter to you. Here’s how policy flows into other assets, with the caveats.
Stocks and ETFs
Higher rates raise companies’ borrowing costs and the discount rate investors use to value future earnings. That tends to hit long-duration growth stocks harder than value stocks, and it makes bonds a stronger competitor for dividend stocks. Lower rates don’t automatically lift stocks, though. If rates are falling because a recession is coming, weaker earnings can outweigh cheaper money. (For a defensive angle, see defensive UK stocks for uncertain times.)
Government Bonds
Bond prices move opposite to yields. Short-term yields track expected policy rates closely. Longer-term yields also reflect expected inflation, growth, government borrowing and a “term premium” for risk. In September 2026, US 10-year yields were near 5% while the Fed’s policy rate topped out at 4%, a reminder that the policy rate and long-term yields are different things.
Gold
Gold pays no interest, so higher real (inflation-adjusted) yields raise the cost of holding it, and a stronger dollar makes it pricier for non-US buyers. Uncertainty and central bank buying can outweigh both. Gold doesn’t always rise when rates fall. (See why gold and oil can climb together.)
Commodities and Commodity Currencies
Most commodities are priced in dollars, so Fed policy and the dollar affect them directly. For Australia and New Zealand, commodity prices feed back into the currency and into the inflation outlook, which then shapes RBA and RBNZ decisions.
Cryptocurrency
Crypto tends to respond to global liquidity and risk appetite: easier money has often coincided with stronger crypto markets, and tighter money with weaker ones. The relationship is loose and unreliable over short periods, so treat it as background, not a trading signal. (See how Fed policy feeds into bitcoin.)
Three Central Bank Policy Divergence Examples
These examples use verified historical levels. They show the mechanism, not a repeatable trading strategy.
1. Fed vs ECB: EUR/USD Breaks Parity (2022)
The setup: In 2022, the Fed started hiking in March and moved in large steps. The ECB didn’t raise rates until July. The expected US–eurozone rate gap widened quickly, and Europe faced an energy shock after Russia’s invasion of Ukraine.
What happened: EUR/USD fell from about 1.14 in early 2022 to below 1.00 (parity) and hit a low of about 0.953 in September 2022.
Why bond yields mattered: US 2-year yields rose much faster than German yields, so holding dollars paid more.
What turned it: once the ECB caught up with large hikes and markets began expecting the Fed to slow, the gap narrowed and EUR/USD recovered to about 1.07 by the end of 2022. Divergence trends end when expectations converge.
2. Fed vs BoJ: USD/JPY, the Carry Trade and the 2026 Hike
The setup: From 2022 to 2024 the Fed raised rates to over 5% while the BoJ held near zero. That huge differential made borrowing yen to buy dollar assets very attractive.
What happened: USD/JPY rose from about 115 in early 2022 to about 152 in October 2022 and about 162 in July 2024. Japan’s Ministry of Finance intervened to buy yen in 2022 and 2024.
How carry trades amplified it, both ways: when the BoJ hiked in July 2024 and US data softened, crowded positions unwound and USD/JPY dropped toward 142 within weeks.
2026 twist: even after the BoJ’s September 2026 hike to 1.25%, the gap to the Fed stayed around 2.5 points. With the Fed also hiking, USD/JPY stayed high, trading near 158 in late October 2026.
What could invalidate the pattern: faster BoJ hikes, a Fed pivot, intervention or a sharp risk-off move.
3. RBA vs RBNZ: Why AUD/NZD Rallied (2025–2026)
The setup: The RBNZ hiked earlier and further in the last cycle (to 5.50%) than the RBA (4.35%). Then it cut much harder, to 2.25%, while the RBA only trimmed to 3.60%. In 2026 both banks hiked, but the RBA went further: by October 2026 the RBA was at 4.60% and the RBNZ at 2.75%, a 1.85-point gap in Australia’s favour.
What happened: AUD/NZD climbed from about 1.08 in mid-2025 to about 1.235 in October 2026, a rise of roughly 14%.
The lesson: a cross like AUD/NZD reflects relative conditions, not whether either economy is “strong.” Inflation, rate expectations, employment and commodity mix all feed the comparison. A sharp rebound in NZ inflation, a run of weak Australian jobs data (unemployment rose to 4.6% in August 2026) or a fall in iron ore prices could narrow the gap.
If you want to follow these three pairs yourself, using the same economic calendar and price feed for all three makes the relationships much easier to spot.
Follow the divergence trades
EUR/USD, USD/JPY and AUD/NZD in one place
The three case studies above all come down to one question: how is the gap between two central banks changing? Watching the pairs side by side with an economic calendar makes those shifts much easier to see.
Pepperstone offers forex CFDs on the major pairs and crosses, plus an economic calendar, on MT4, MT5, cTrader and TradingView. Use it to track divergence themes, and remember that past patterns don’t guarantee future moves.
Affiliate link. CFDs are complex instruments and come with a high risk of losing money rapidly due to leverage.
Most retail investor accounts lose money when trading CFDs. Consider whether you understand how CFDs work and
whether you can afford to take the high risk of losing your money. Availability and protections depend on your
country of residence.
How Beginners Can Monitor Central Banks: A 5-Step Framework
You don’t need to read every headline. Use this research routine for any pair.
- Identify the two central banks. EUR/USD means the ECB and the Fed. AUD/NZD means the RBA and the RBNZ.
- Check the latest inflation and jobs data for both. Do they support or challenge each bank’s current stance?
- Compare expectations with the latest guidance. Is each bank expected to hike, hold or cut, and how fast? Has the guidance shifted?
- Look at 2-year yields and the pair itself. Is the market already pricing the move you expect?
- List what could invalidate your view. Surprise inflation, weak growth, fiscal news, geopolitical shocks, intervention or a change in global risk appetite.
This is an educational research framework, not a trading strategy. For a weekly view of what’s on the calendar, see our weekly forex pairs and commodities watchlist.

Risks to Keep in Mind
- Event volatility: prices can gap and spreads can widen sharply around decisions and data releases.
- Leverage: forex and CFD trading magnify gains and losses. Most retail CFD accounts lose money.
- Headline whipsaw: first reactions often reverse once the full message is digested.
- Intervention: governments, especially Japan’s, can move currencies abruptly.
- Stale data: policy rates, targets and schedules change. Always check the official source.
Frequently Asked Questions
What are the six major central banks?
They are the Federal Reserve (US), European Central Bank (euro area), Bank of Japan, Bank of England, Reserve Bank of Australia and Reserve Bank of New Zealand. Together they set interest rates for the USD, EUR, JPY, GBP, AUD and NZD, which appear in most actively traded currency pairs.
What does a central bank do?
A central bank sets short-term interest rates, manages the money supply and bank reserves, and acts as lender of last resort. In most advanced economies its main legal goal is low, stable inflation.
Why does the Federal Reserve affect the global economy?
The US dollar is the world’s main reserve, trade and funding currency. When the Fed changes rates, global borrowing costs, capital flows, commodity prices and other currencies tend to adjust.
How do central banks influence forex markets?
Mainly through interest rate expectations. When markets expect one bank to keep rates higher than another, capital can flow toward that currency. Guidance, projections and balance-sheet policy add to the effect.
Does raising interest rates strengthen a currency?
Often, but not always. If a hike is fully expected, or comes with dovish guidance, the currency can fall. The yen weakened after the BoJ’s September 2026 hike for exactly these reasons.
What is the difference between hawkish and dovish monetary policy?
Hawkish means leaning toward tighter policy to fight inflation. Dovish means leaning toward easier policy to support growth. Both are judged against what markets already expected.
What is monetary policy divergence?
It’s when two central banks move rates in different directions or at different speeds. The widening or narrowing rate gap often drives a currency pair’s trend, as with AUD/NZD in 2025–2026.
Why is the Bank of Japan important to forex traders?
Japan kept rates near or below zero for decades, so the yen became a key funding currency for carry trades. BoJ policy shifts can trigger large yen moves that ripple through global markets.
Which economic indicators do central banks watch most closely?
Inflation (CPI, PCE or HICP and their core measures), the labour market (jobs, unemployment and wages), economic growth and inflation expectations. Each bank has its own preferred gauges.
How can beginners follow central bank decisions?
Use an economic calendar, read the official statement on each bank’s website, and compare the decision and guidance with what was expected. Then check 2-year bond yields and the currency pair to see how the market interpreted it.
Conclusion
Having the major central banks explained is less about memorising six policy rates and more about learning one habit: always compare. Compare the decision with expectations. Compare the guidance with the last statement. Compare one central bank’s path with the bank on the other side of the pair.
2026 has been a vivid reminder. An energy shock pushed most of these banks back into rate hikes, yet the currencies didn’t simply follow the headlines. The yen fell on a hike, the Aussie fell on firm inflation, and AUD/NZD rallied on a gap that built up over two years. Follow the official announcements, judge them against market expectations, and ask what could prove you wrong. That’s how you turn central bank noise into understanding.
Ready to put the framework to work?
Turn central bank analysis into a trading plan, carefully
If you plan to trade currencies around monetary policy, choose a regulated broker with tight spreads on the majors, clear pricing around high-impact events and a demo account to practise on.
Pepperstone is a forex and CFD broker regulated in several jurisdictions. Start with the demo, size positions small and keep the 5-step framework’s last question in mind: what could invalidate your view?
Learn more about Pepperstone →
Want the full picture first? Read our Pepperstone review.
Affiliate link. CFDs are complex instruments and come with a high risk of losing money rapidly due to leverage.
Most retail investor accounts lose money when trading CFDs. Consider whether you understand how CFDs work and
whether you can afford to take the high risk of losing your money. Availability and protections depend on your
country of residence.
Disclosure: The content on this page was produced with AI writing assistance under the editorial direction of a licensed Electrical Engineering practitioner and certified investor in different markets with over a decade of experience. All articles are reviewed and approved by the author before publication.
Promotion
Views: 26