
Grain Of Salt: Analyzing The Results From Past exBEERiments On Mineral Adjustments To Brewing Water


Author: Marshall Schott
Long before anyone could pull a water report or even knew what “brewing salts” were, brewers noticed beer tasted different depending on where it was made. The hard, sulfate-rich water of Burton-on-Trent is often credited for the crisp, hoppy pale ales the town became known for, while the soft water in Pilsen gets some of the credit for the delicate lagers associated with that region. These days, the conversation mostly centers on sulfate and chloride, the former said to accentuate hop bitterness and dryness while the latter is believed to round out malt flavor and fullness.
Unlike the brewers of yore, modern brewers can start with RO water and build just about any profile to achieve their desired outcome. This has led to some pretty strong opinions about what exactly to add, how much, and in what ratio, though loads of excellent beer gets made with plain tap water. Considering how much effort goes into dialing in a water profile, whether anyone can actually tell the difference is a fair question.
Soon after starting the exBEERiment series, a buddy of mine, Dan Paris, and I got into it over this very topic. He swore adjusting water made a difference, I had a pile of anecdotes saying otherwise, and we’d just about agreed to disagree before he challenged me to put it to the test. That led to my first water chemistry xBmt, and in the years since, we’ve run a handful of subsequent xBmts focused on the impact mineral additions to the mash have on beer. With 8 sets of results in the archives, it seemed a good time to look at them together and see if the bigger picture tells us anything more than a single result can on its own.
| Framework |
Each of these xBmts relied on the triangle test where blind tasters are given three samples, two of which are the same beer and one of which is different, and asked to identify the unique sample. When tasters fail to identify the different sample more often than chance would predict, that result is treated as evidence the variable in question isn’t reliably perceptible to the group tested. A non-significant result does not indicate a variable has no effect on the finished beer, only that a panel of blind tasters couldn’t reliably distinguish the beers. A few of the xBmts below occurred during the COVID-19 pandemic, which involved the brewer performing a set of semi-blind triangle tests; the math was the same, it was just 1 palate over the course of 10 trials instead of a panel of blind tasters.
| exBEERiments |
Each of the following xBmts compared 2 versions of the same beer where the intended difference was the mineral content of the brewing liquor, adjusted using common brewing salts. All ion levels are in ppm.
German Pils: Untreated vs. Treated Water

When water chemistry was just starting to get on my radar, I compared a German Pils made with filtered tap that was nearly devoid of minerals (Ca 4, SO4 6, Cl 2) to one made with the same water built up to a Dortmund-style profile (Ca 145, Mg 24, SO4 302, Cl 99). To reiterate my perspective at the time – I was not at all convinced this would have a noticeable impact and was encouraged to perform this xBmt by a friend of Brülosophy.
Participants: 15
Expected: 9
Actual: 9
p-value: 0.03 – significant
I was wrong! Not only did this reach the threshold of significance, but of the 9 tasters who got it right, most preferred the version treated with salts. And despite my skepticism, I was able to rather easily pick the odd-beer-out, finding the treated one crisper and lighter with a sharper hop bitterness that balanced the malt, while the untreated beer was more malt-forward and lacked the crispness I expect from a German Pils. It wasn’t bad, just different. Of course, the acid and subsequent mash pH differences mean we couldn’t say with confidence it was specifically due to the mineral additions, but it did influence the way I view water chemistry.
American IPA: High Sulfate vs. High Chloride
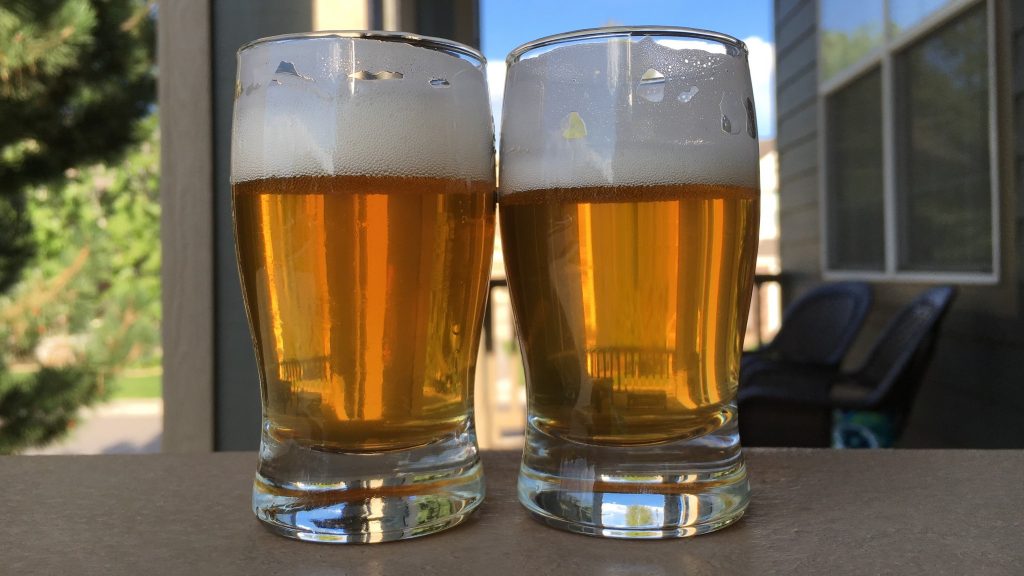
Having found that first xBmt fascinating, Jake Huolihan was curious to continue exploring water chemistry and compared an IPA with a sulfate-to-chloride ratio of 3:1 (150:50 ppm) to one with a ratio of 1:3 (50:150 ppm) using gypsum and calcium chloride. Unexpectedly, though likely not terribly meaningful, Jake noted that the high sulfate beer finished at 1.005 FG while the high chloride beer was at 1.006 FG.
Participants: 22
Expected: 12
Actual: 14
p-value: 0.003 – significant
Yet again, a significant result, though in this particular case, the preference was split with 5 liking the high chloride beer more, 4 liking the high sulfate beer more, 3 having no preference, and 2 stating they couldn’t tell a difference between the samples. Jake found the high sulfate beer to be more bitter and assertive with hops that popped and a drier finish, while the high chloride beer felt smoother and mouth coating, even a little chalky, with muted hop character. Fellow contributor, Ray Found, did a series of semi-blind triangle tests during a visit to Denver and was able to identify the unique sample mostly by mouthfeel, describing the high chloride beer as soft. Interestingly, despite the high chloride wort being slightly hazier at runoff, the finished beers were equally as clear, which goes against the notion that chloride is a culprit for haze.
Best Bitter: High vs. Low Mineral Load, Same Ratio

Having heard that the ratio of sulfate-to-chloride matters more than the total ion concentrations, Jake designed an xBmt to see if that claim held up. He compared a Best Bitter made with a high mineral load (Ca 138, SO4 200, Cl 100) to one made with a low mineral load (Ca 35, SO4 51, Cl 27), with both landing right around 2:1 sulfate-to-chloride. He then served these beers to members of the Parker Hopaholics Homebrew Club, all of whom were blind to the variable.
Participants: 22
Expected: 12
Actual: 8
p-value: 0.46 – not significant
While Jake later reported he was initially confident he’d be able to pick the odd-beer-out, he was wrong, as he failed to do in all of his own semi-blind attempts. He felt both beers were excellent examples of Best Bitter that tasted identical, which was backed up by the blind taster data. This result seemed to confirm with the idea that sulfate-to-chloride ratio is more important that total mineral concentration, which was fascinating.
California Common: Low vs. High Sodium

Water chemistry became a special interest of Jake’s, and he was interested in exploring some of the less talked-about aspects of this variable. His late grandfather always salted his Miller, a habit Jake and his brother carried on with Miller Lite, which got him wondering what impact higher levels of sodium have when added to the mash. To test it out, he compared a California Common made with water adjusted to 100 ppm sodium using table salt to a batch made with water that had a more typical 8 ppm sodium. It should be noted that because table salt also adds chloride, Jake used a small dose of calcium chloride in the low sodium water to even things out, resulting in a calcium difference of ~77 ppm.
Participants: 29
Expected: 15
Actual: 16
p-value: 0.013 – significant
Like the rest of the Brülosophy crew, Jake was not surprised with the fact this xBmt was significant and was consistently able to easily identify the unique sample in his own semi-blind triangle tests. What he wasn’t expecting was to prefer the high sodium beer, as he thought it was going to have a noticeable saltiness, which it did not. Rather, he perceived it as cleaner with a more pronounced hop aroma, sharper flavors, and crisper mouthfeel. Of the 16 blind tasters who identified the unique sample, preference was evenly split, yet again confirming the subjectivity of preference. To note, while there’s little evidence to suggest calcium has a perceptible impact on beer, the difference in concentrations means we can’t know for sure that sodium alone was responsible for this result, something several readers were quick to comment on.
Czech Premium Pale Lager: Straight vs. Adjusted RO Water
Matt Del Fiacco entered the water chemistry game by comparing a Czech Premium Pale Lager made with straight RO water to one where the RO water was built up with gypsum, Epsom salt, and calcium chloride (Ca 50, Mg 5, SO4 60, Cl 60). While he typically fined his beers with gelatin, he skipped doing so for these beers, as he was curious to see what impact minerals might have on clarity.
Participants: 22
Expected: 12
Actual: 14
p-value: 0.003 – significant
At this point, with several past water chemistry xBmts being significant, Matt more or less expected this result, and while not perfect, he was able to identify the odd-beer-out in 4 out of 5 of his semi-blind triangle test attempts. Of the 14 blind tasters who were correct, 7 preferred the adjusted beer, 3 liked the straight RO beer more, 3 had no preference, and 1 perceived no difference. Matt described the adjusted beer as having a fuller flavor with a more expressive hop aroma, while the straight RO beer, though enjoyable, seemed less characteristically clean. Neither beer cleared noticeably better, and Matt surmised that the OG difference was likely too small to have had any influence.
Blonde Ale: Straight vs. Adjusted RO Water

When the COVID-19 pandemic disallowed us to collect data from blind tasters, we opted to re-test variables we’d previously focused on and increase our number of semi-blind triangle tests. Andy Carter chose to compare a Blonde Ale made with straight RO water to one made with RO water that was adjusted with salts (Ca 55, Mg 5, SO4 72, Cl 59). In this case, the beers started at the same 1.046 OG, suggesting mineral concentrations likely played little role conversion efficiency, though the version made with straight RO finished at 1.007 FG while the one adjusted with salts was at 1.006 FG.
Trials: 10
Expected: 7
Actual: 4
p-value: 0.44 – not significant
While Andy figured he’d be able to tell these apart given his experience as well as prior xBmt findings, his semi-blind triangle test performance told a different story, and he was forced to admit the beers tasted the same to him. He noted his inability to tell them apart may have been due to the fruity hops and yeast covering up any differences, or that his palate just sucks. Either way, this result did not change his mind when it comes to adjusting his brewing water with salts.
Hazy IPA: High vs. Low Sulfate-to-Chloride Ratio

To further explore the impact water chemistry has on Hazy IPA during the COVID-19 pandemic, Andy tested sulfate-to-chloride ratio by building RO water to either 3:1 (124:42 ppm) or 1:3 (41:123ppm) with calcium levels being matched (76 ppm). Again, both beers started at the same 1.067 OG, and in this case, they finished at the same 1.010 FG.
Trials: 10
Expected: 7
Actual: 4
p-value: 0.44 – not significant
Once again, Andy’s performance indicated he could not perceive a difference between these beers, and he acknowledged that they were identical to his palate. He described a big hop character of mango, pineapple, and a touch of dankness, along with a slight hop burn he found distracting, so it’s possible the hops may have covered up any differences. In addition to the fact this was a semi-blind triangle test with just 10 trials, readers were quick to note the ion levels in the adjusted batch were relatively low, though this was also questioned by some.
British Brown Ale: High vs. Low Sulfate-to-Chloride Ratio
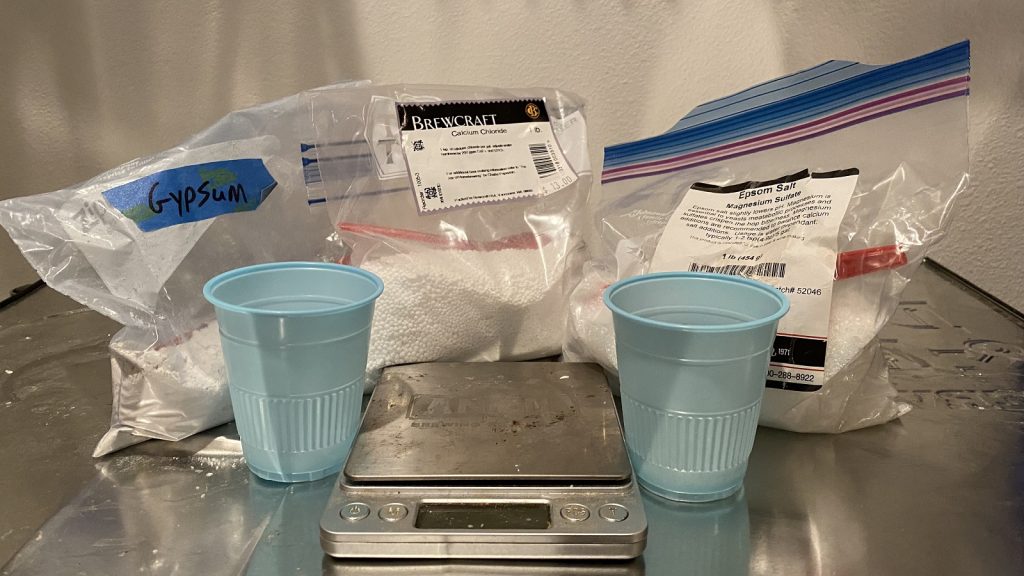
Wanting to see how differing mineral concentrations affect a malty style, Cade Jobe compared a British Brown Ale adjusted to a 4:1 sulfate-to-chloride ratio (159:39 ppm) to one adjusted to a 1:4 ratio (37:156 ppm) where both had identical levels of calcium, magnesium, and sodium. Similar to Andy’s experience, both beers started at the same 1.043 OG, while the high sulfate beer finished at 1.009 FG and the high chloride beer finished at 1.007 FG.
Trials: 10
Expected: 7
Actual: 9
p-value: 0.0004 – significant
Also flying solo due to the pandemic, Cade nailed 9 of 10 of his semi-blind triangle tests, describing the high sulfate beer as earthy with a crisp finish while he felt the high chloride beer had more caramel and toffee flavors with a softer finish. He preferred the latter, as it was closer to what he expects from a Brown Ale, though he felt the high sulfate beer was still a great British Brown Ale.
| CONCLUSION |
Tallying everything up, 5 of the 8 xBmts returned significant results, though it’s important to acknowledge that 3 relied on our COVID-19 protocol, and of those, 2 were performed by the same contributor who acknowledged he may not be as sensitive to the impact of mineral adjustments as others. Of the standard protocol xBmts, the only significant finding was from the one comparing beers with identical sulfate-to-chloride ratios despite having vastly different total ion concentrations. So, what exactly does this imply?
I think it’s safe to say that, like salt on food, minerals added to brewing water can have a notable impact, though ratios may matter more than the actual amounts of specific minerals. It’s also possible that some people may not be as able to perceive the effect mineralization has on beer, which is to be accepted given the idiosyncrasies of being human, which is made all the more apparent by the preference data, which was all over the place.
For as much focus as water chemistry gets, I was surprised to discover that there are very few controlled sensory experiments out there, but those that do exist seem to align with our xBmt findings. At the 2019 Big Beers seminar, several breweries brewed the same beer twice with different waters then had the results analyzed at Sierra Nevada where tasters performed triangle tests. Interestingly, only the NEIPA was significant, while a Saison, a pale lager, and a Stout were not, leading the presenters to posit that other brewing variables may outweigh water chemistry. A Brew Your Own club tasting found 100 ppm of sulfate from gypsum was detectable in blind triangle tests, with higher chloride being described as contributing a rounder and fuller character to beer.
I’m wholly convinced that minerals, particularly sulfate and chloride, have a meaningful impact on beer character, at least most of the time, which is the exact opposite opinion I held prior to performing that first water chemistry xBmt over a decade ago. Are there times water adjustments don’t have an effect? Perhaps, but I wouldn’t know because I adjust my brewing water as a matter of course for every batch I brew these days. I’m often asked what I used to determine the mineral profiles of my brewing water, and my answer is usually less impressive than some expect – with rare exception, I tend to aim for a sulfate-to-chloride ratio of around 2:1, adding only gypsum and calcium chloride to RO water. When making British styles, I will sometimes opt for a balanced profile, and I’ll occasionally use a pinch of baking soda in super pale beers. One approach I think is futile is matching known regional water profiles, like Burton-on-Trent, as it’s fairly well accepted that the early brewers in those areas were likely adjusting their water to achieve their desired outcome. And while I’m find being labeled a “water chemistry advocate,” I’m not convinced such adjustments are necessary to produce world-class beers, but that it is a tool that can be used as a means of achieving one’s goals, another knob brewers can use to tweak the overall profile of a beer.
If you have any thoughts about this analysis, please do not hesitate to share in the comments section below!
Support Brülosophy In Style!


Follow Brülosophy on:
FACEBOOK | TWITTER | INSTAGRAM

If you enjoy this stuff and feel compelled to support Brulosophy.com, please check out the Support page for details on how you can very easily do so. Thanks!
Related